From the AMD perspective, how the K-line on the chart is formed
- 2025年7月1日
- Posted by: Eagletrader
- Category: News
In technical analysis, K-line is the most basic price graph and is also the core basis for traders’ daily decision-making. However, behind each K-line is not just the fluctuation between the opening price and the closing price, but a mapping of a complete market behavior. With the help of AMD analysis method (Accumulation-
Manipulation-Distribution), we can reveal the internal structure of the K-line formation and identify trading opportunities more scientifically.
1. The essence of the K-line structure
From a higher dimension, each K-line actually condenses a behavior chain in a lower time period. For example, a daily K-line (D1) may appear as the following process in the 15-minute chart (M15):
Accumulation period: Price consolidation sideways, liquidity slowly accumulates, and usually occurs near the K-line opening price.
Manipulation period: The price “false breakthrough” in one direction, forming a shadow line, inducing long/short short, and inspiring stop loss.
Distribution period: The real trend starts, the price advances rapidly in a certain direction, forming the main body of the K-line.
In other words, the K-line is not an isolated graph, but a compressed perspective of market behavior. Understanding the structure behind it helps us identify the true intentions of different participants (such as large funds).
2. Top-down analysis method
In order to more effectively identify the AMD stage and seize the opportunity to enter, it is recommended to use the top-down analysis method (Top-down analysis):
Observe the macro structure from the high cycle (such as weekly W1 and daily line D1), confirm the main trend direction and key support/resistance areas;
Identify the local AMD stage in the low cycle (such as H1 and M15), and find the breakthrough or fallback entry signal after manipulation.
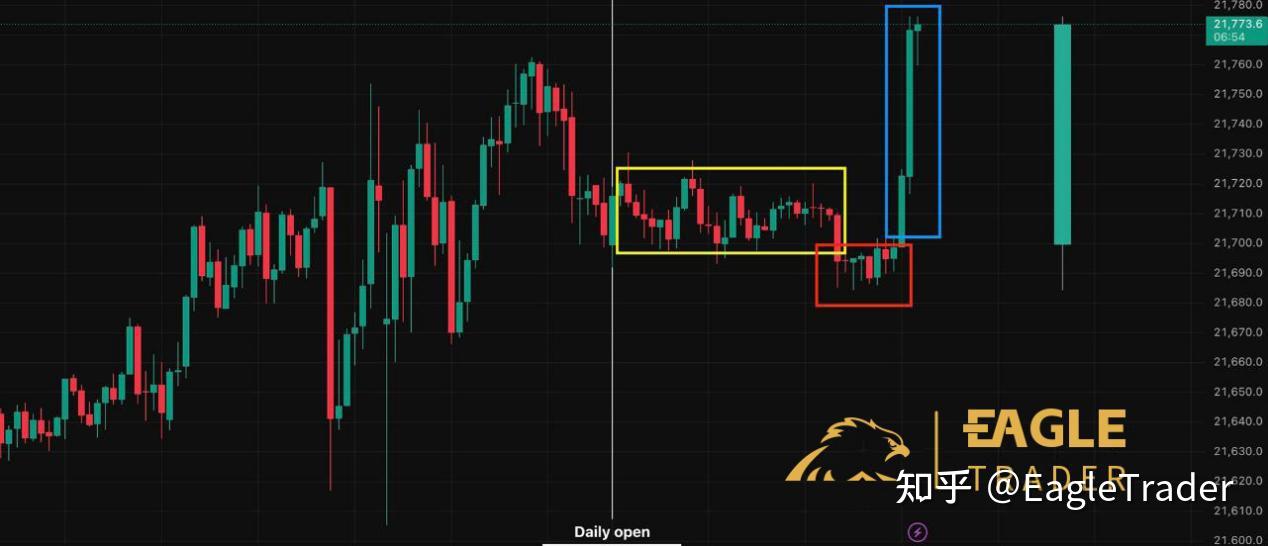
For example:
A strong positive line appears in the D1 cycle;
In the M15 chart of that day, you can see that the price first fluctuates (accumulates) in the narrow consolidation zone, then falls downwards (manipulates), and eventually rises strongly and breaks through the consolidation zone (distribution);
If the entry point is in the early stage of distribution or confirms the retracement position, not only the signal is clear, but the risk-return ratio (RRR) can also be optimized.
This unified analysis method of “macro trend + microstructure” helps traders make more logical supportSupport decisions.
3. Do not mechanically apply the AMD model
Although AMD structure has extremely high guiding significance, in actual use, the following two misunderstandings are common:
(1). Force segmentation and ignore market background
Newcomers often try to find “accumulation-manipulation-distribution” in each fluctuation, but in fact, AMD structure does not appear mechanically periodically, and the premise is that the market has sufficient liquidity and trading intentions, which are often in key positions or the main control stage.
(2). Too hurry and not wait for confirmation signals
Many traders enter the market early during the accumulation period, or misjudgment the trend direction during the manipulation period, resulting in frequent stop loss. A better way is to wait for the distribution period signal to confirm, such as trend breakthrough, retracement confirmation, order block response, etc., to significantly improve the winning rate of entry.
4. Practical advice
It is recommended to practice through actual charts. Taking EUR/USD (EUR/USD) as an example: select a significant K-line in the daily line (D1) chart; switch to the 15-minute (M15) chart to observe the structure within the daily K-line;
Try to mark the following three stages:
Where is the consolidation zone (accumulation period)?
Where is the false breakthrough (manipulation period)?
How to expand the main trend movement (distribution period)?
Training like this helps you build a trading perspective from the whole to the details, from logic to the signal, so that you no longer make decisions based on intuition or indicators alone.
The significance of AMD analysis is not to predict the future, but to understand the present. Each K-line tells a market story, and the AMD structure provides us with the “grammar” to understand this story.
Master the structure and understand the intention, and you will identify real trading opportunities earlier – and in financial markets, this step often determines the dividing line between profit and loss.
Suggest try: Practice AMD marking on the M15 chart of any trading symbol, and compare the corresponding D1 structure to improve your market acuity and rhythm.