
Footprint order flow practice: 3 types of key price points to help you filter blind entries
- 2026年9月16日
- Posted by: Eagletrader
- Category: News
Order flow is like a magnifying glass for traders to observe the market.
It can help us see the real buying and selling behavior behind the K-line, but the real value is not to observe a certain order flow signal alone, but to know where to focus the observation.
In actual trading, the key support and resistance areas (Support & Resistance, S&R) are often the locations where order flow deserves the most attention.
In this EagleTrader strategy sharing, we will start from the Footprint footprint chart, sort out several key price levels of order flow that deserve special attention, and further dissect a set of trading ideas that combine support and resistance with order flow signals.
Magnetic price levels: Which positions are more likely to have reversals?
Most traders are familiar with traditional support and resistance, such as all-time highs and lows.
But the Footprint footprint chart can also help us discover some “hidden prices” that are not easily visible directly on ordinary K-lines.
These positions tend to have a strong attraction to prices and may also become important support and resistance in the future.
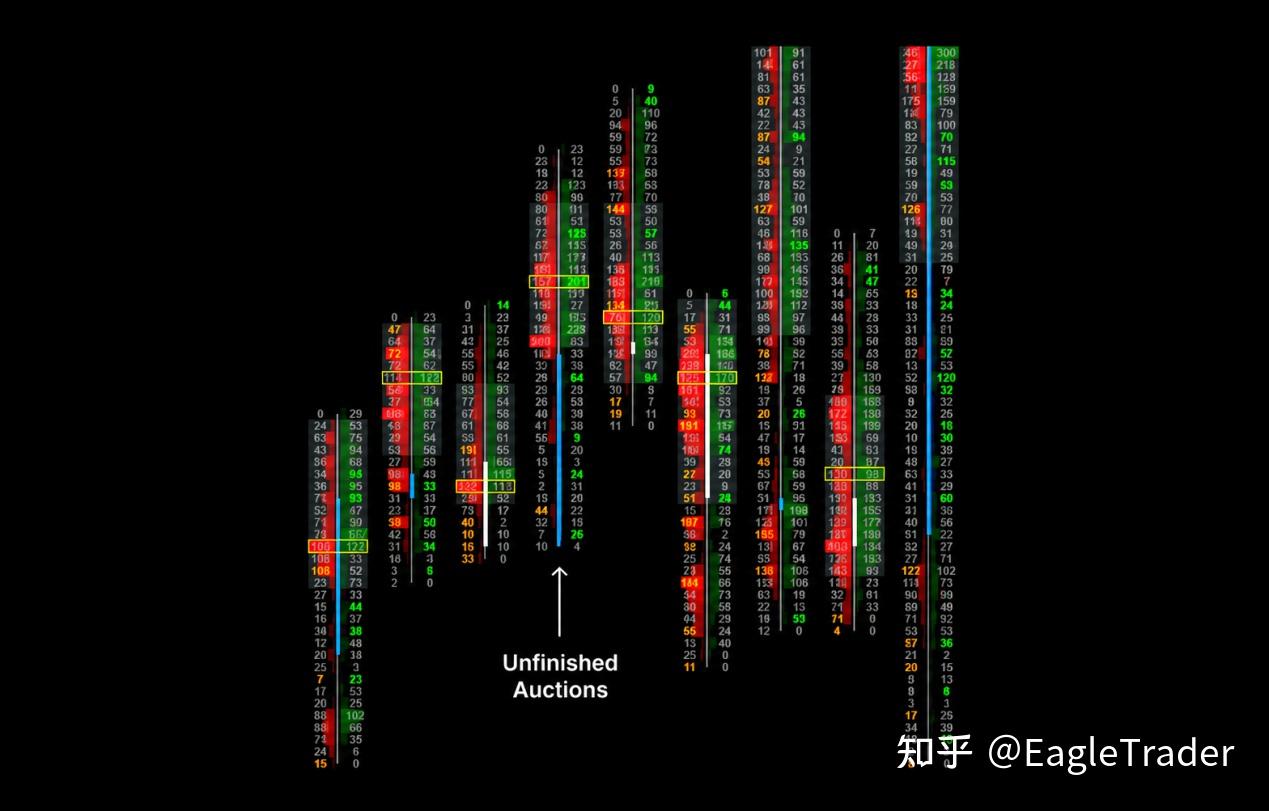
1. Unfinished Auction
Let’s say the market is rising rapidly.In Footprint, if the highest price of the highest K-line is at the highest price, there are still transactions on both sides of Bid and Ask, for example: Bid 10 × Ask 4
Under normal circumstances, at the extreme position of the K line, the trading volume on one side should usually approach 0.
If there are still transactions on both sides of the highest point or lowest point, it forms a so-called unfinished auction.
This means that the bidding process at this price is not completely over, so the price will often come back here for testing later.These types of positions typically serve as:
Potential take-profit targets;
Important areas of support or resistance in the future.
2. LVN and untested VPOC
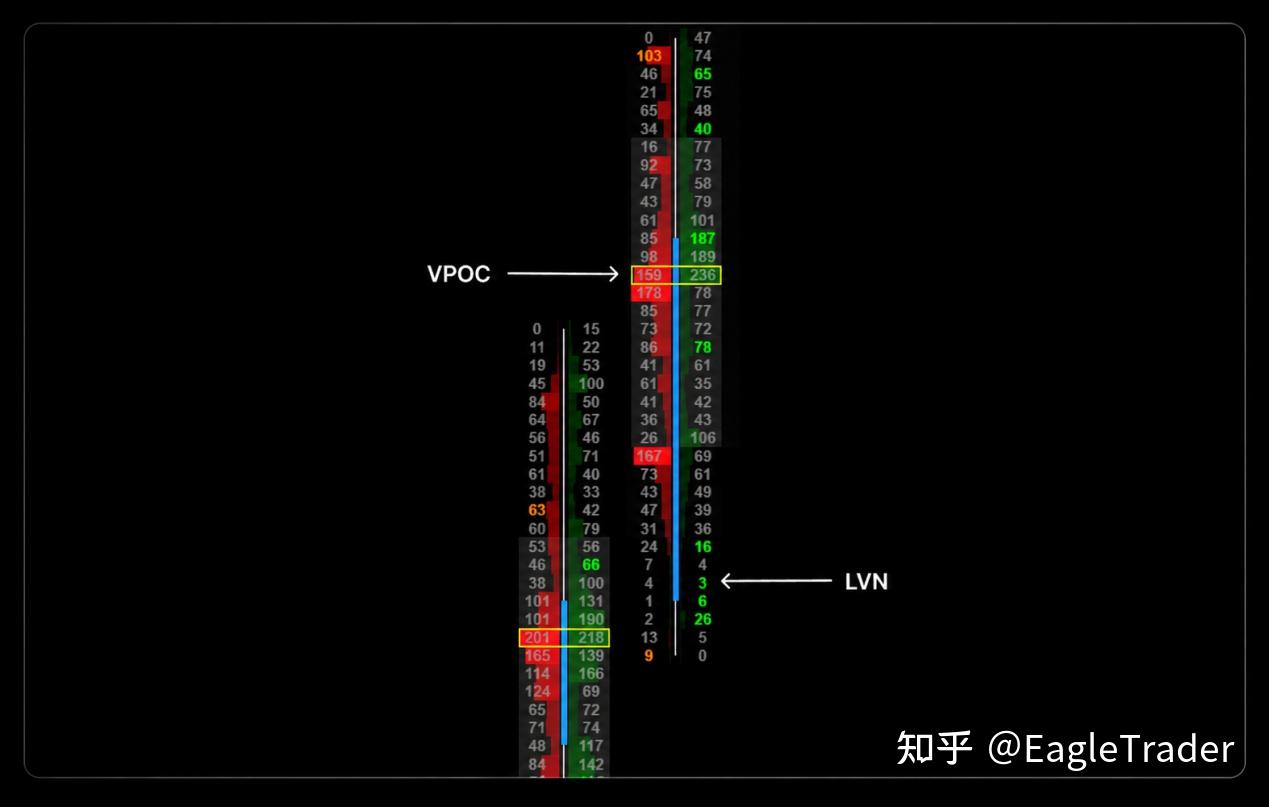
LVN(Low Volume
Node, Low Volume Node) LVN is a price area with significantly low volume, which often looks like a volume “hole” or close to 0 position on the Footprint.
This means that price moved quickly through this area and did not result in full volume.
When price later retraces an untested LVN, one of two things usually happens: either it crosses quickly, or it rebounds or pulls back very accurately.
Therefore, untested LVN is often a price area worth focusing on.
VPOC (Volume Point of Control, Volume Control Point) VPOC is the specific price position with the largest trading volume on a certain K-line or a certain trading period.
If a VPOC has not been retested after it is formed, it will often become an important attraction area for future prices, and may also form strong support or resistance.
A common rule of thumb is that the more multiple untested VPOCs are concentrated in similar areas, the more important the area is.
3. Zero transactions within Footprint (Zero Prints/Single Prints)
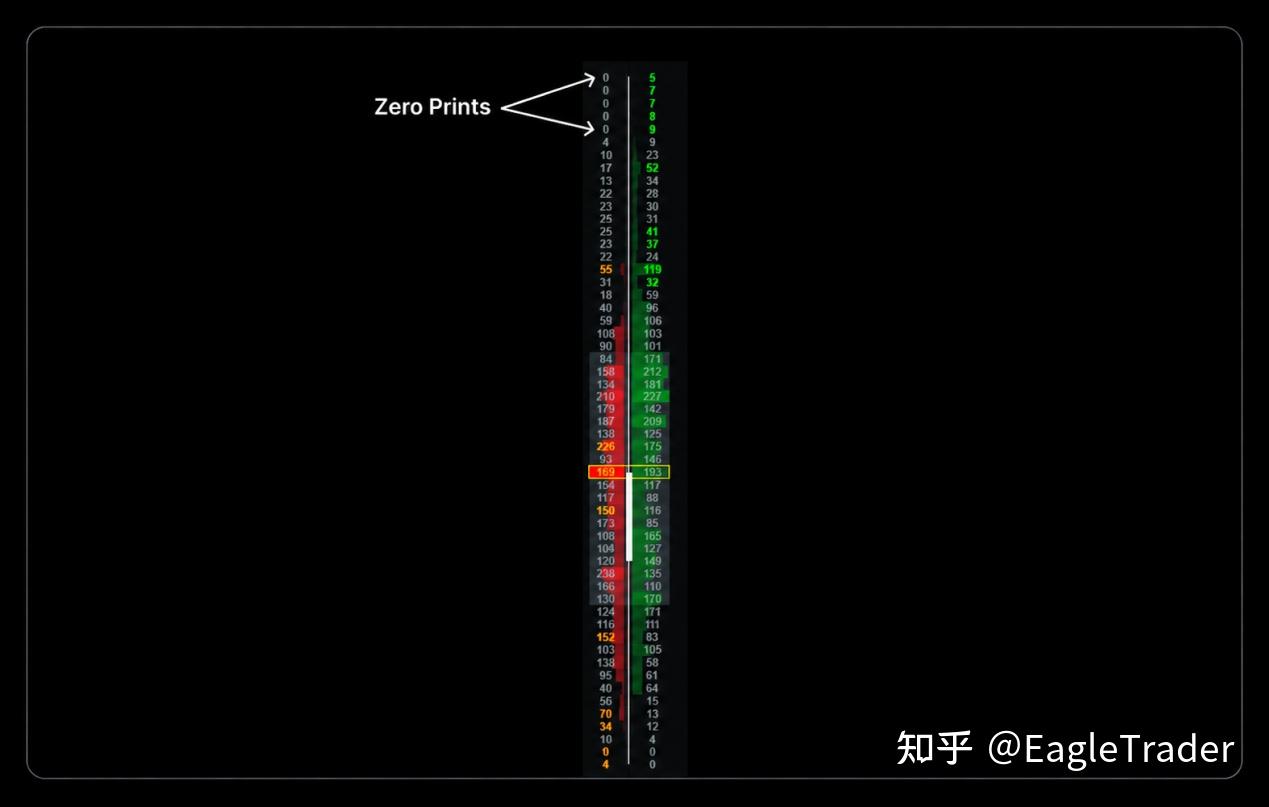
Sometimes, you will see a “0” inside the K-line instead of appearing at the highest or lowest point.This usually happens in very aggressive, fast moves.
For example, a large number of active buying orders quickly swept up the liquidity, and the price rose too fast, so that the Bid side had no time to form a valid transaction, so a 0 was left inside the Footprint.
This structure is usually called: Zero Print or Single Print.It can be understood as the “trading gap” left during the rapid price movement.
Because price moves quickly through this area, the market often comes back to test and fill this position before continuing the trend.Therefore, this type of area is ideal for observing trend continuation entry opportunities.
Combining market conditions with order flow: trading
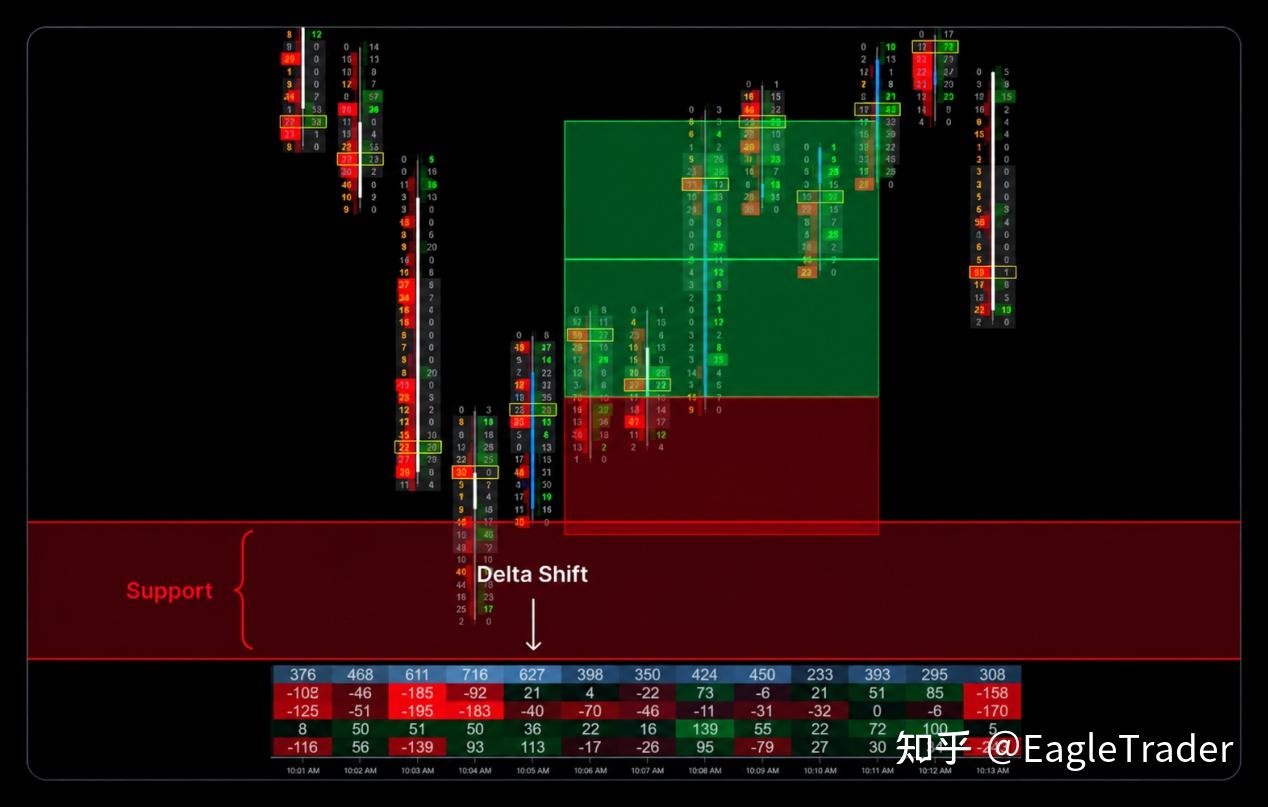
Once you understand the key price levels, the next step is to combine these levels with order flow signals.Taking the long transaction (LONG) as an example below, the short logic can be understood in reverse.
1. Basic environment
Price first needs to come to a clear and valid support and resistance area.For example: daily support level; LVN that was not tested on the previous trading day; or other important support areas.
2. Delta changes
Focus on observing whether there is a significant change in Delta. The ideal situation is: from negative to positive.This shows that the active selling that previously drove the price down is weakening, and the active buying is gradually taking over.
3. K-line structure
Expect to see a declining candlestick enter the support area, followed immediately by a rising reversal candlestick.In other words: the price first fell into the key area, and then quickly reacted in the opposite direction.
4. VPOC location
For an ideal long structure, the reversal K-line is best able to: close above its own VPOC.This is very important.Because this means that the buyer not only entered the market, but also successfully pushed the price above the most densely traded area of the K-line.
5.Admission
When the reversal K-line closes and the above conditions are met, you can consider executing the transaction.The ideal entry position is: above the reversal K line VPOC.
6. Stop loss
Stops can be placed below key support areas; or, if the support area is wider, below the reversal candlestick low.
7. Take profit
There are two ways of thinking about taking profit.
Method A: Fixed profit and loss
Ratio such as: 2:1 or 3:1.
Method B: Dynamic target
Set targets based on key “magnetic price levels” in the direction of the trade, such as: unfinished bidding; untested VPOC; Zero Print.
These positions can be used as potential take-profit references.
5 Important Principles for Order Flow Traders
1. Respect higher time cycles
If you are trading on the 1-minute chart, you should at least simultaneously observe the order flow and market structure at the 15-minute or 30-minute level.
Only in this way can we better understand the general environment in which the current signal is located.
2. Be wary of volatile market conditions
When the market continues to fluctuate sideways and lacks a clear trend, the reliability of some order flow signals, such as large Bid or Absorption, tends to decrease.
3. Distinguish between active transactions and price reactions
Markets are always looking for liquidity and balance.If a very large active order appears but does not push the price in the expected direction, then the order is likely to have been absorbed by the counterparty.
At this time, the price may move in the opposite direction.
4. The market position is higher than a single signal
Even if a very beautiful order flow structure appears on Footprint, if it occurs at a position that has no meaning of support or resistance, its reference value will still be limited.Location is always important.
5. Don’t look for the so-called “win signal”
Footprint can more clearly display the transactions within the market, but trading is still a matter of probability.Any Setup may fail.
Therefore, when large funds in the market sweep away local liquidity, setting a reasonable stop loss is still the most important part of trading risk control.
Order flow does not completely prevent traders from losing money.But it can help us understand more clearly what is happening inside the market, and can also reduce blind entry without basis.
For EagleTrader traders, the real value of Footprint is not to find a “100% effective” signal, but to provide a clearer basis for every trading judgment through mutual verification between order flow, price position and market structure.
This article is only used as EagleTrader trading strategy sharing and market analysis content and does not constitute any investment advice.
There are risks in the financial market, please trade with caution based on your own circumstances.